B- to D0 (K pi) K-
Current status
ntuple
the ntuple is the same as the B2Dpi one, see that page for info, but its at /opt/ppd/lhcb/tbird/ntuples/B2Dpi/str09-merged-data/B2Dpi_str09.rootCuts
zero was found to bes the best pid cut#define Name_Of_Cuts "thomas mod - low mv and dipchi2 with 0 bac pid" #define Negative_D_Daughter_PT_Cut 300 #define Positive_D_Daughter_PT_Cut 300 #define Negative_D_Daughter_MINIPCHI2_Cut 9 #define Positive_D_Daughter_MINIPCHI2_Cut 9 #define Negative_D_Daughter_P_Cut 2000 #define Positive_D_Daughter_P_Cut 2000 #define Negative_D_Daughter_TRACK_CHI2NDOF_Cut 8 #define Positive_D_Daughter_TRACK_CHI2NDOF_Cut 8 #define Bachelor_PT_Cut 300 #define Bachelor_MINIPCHI2_Cut 9 #define Bachelor_P_Cut 2000 #define Bachelor_TRACK_CHI2NDOF_Cut 8 #define Bachelor_PIDK_Cut 0 #define D_FDCHI2_OWNPV_Cut 100 #define Z_Dist_Cut -1 #define D_ENDVERTEX_CHI2_D_ENDVERTEX_NDOF_Cut 15 #define D_IPCHI2_OWNPV_Cut 9 #define D_PT_Cut 2000 #define B_FDCHI2_OWNPV_Cut 64 #define B_ENDVERTEX_CHI2_B_ENDVERTEX_NDOF_Cut 10 #define B_IPCHI2_OWNPV_Cut 16 #define B_DIRA_OWNPV_Cut 0.9999 #define Negative_D_Daughter_PIDK_211_Cut 10 #define Positive_D_Daughter_PIDK_211_Cut 10 #define Positive_D_Daughter_PIDK_321_Cut 10 #define Negative_D_Daughter_PIDK_321_Cut 10 #define D_M_Window_Cut 21 #define B_M_Window_Cut 50no MC study was done with this deacy
Analysis Script
- BachelorAnalsys.C.exe: slightly altered B2Dpi script to work with B2Dk
plots - numbers are wrong
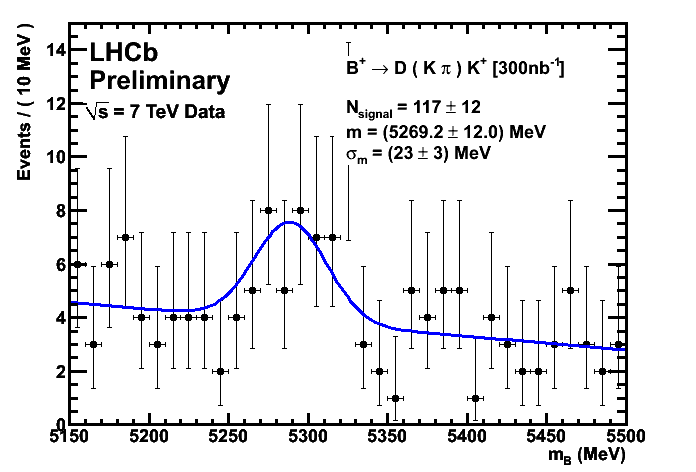
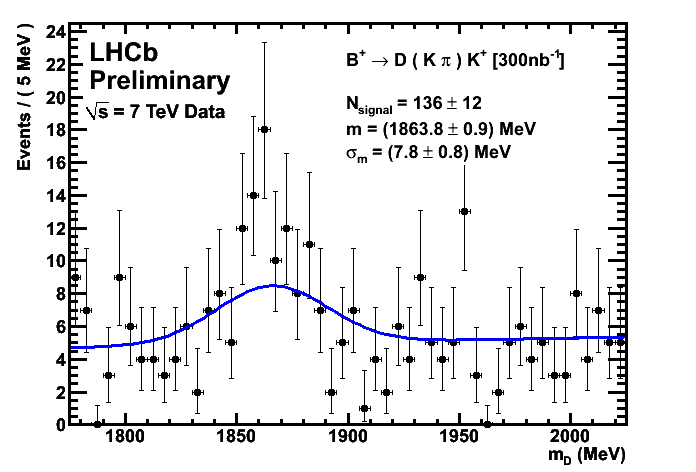
based on graphs made in /opt/ppd/lhcb/tbird/analysis/b2dk/data The number are wrong on the below graphs the real numbers are in the output.txt file and the output of the lhcb-graph-... script when it runs. this is 600/nb of data.- B2DK B mass plot with 600/nb of real data:
- B2DK D mass plot with 600/nb of real data:


| I | Attachment | History | Action | Size | Date | Who | Comment |
|---|---|---|---|---|---|---|---|
| |
BachelorAnalsys.C.exe | r1 | manage | 115.4 K | 2010-09-07 - 15:19 | ThomasBird | slightly altered B2Dpi script to work with B2Dk |
| |
b2dk-600nb-bm.png | r1 | manage | 17.8 K | 2010-09-07 - 15:15 | ThomasBird | B2DK B mass plot with 600/nb of real data |
| |
b2dk-600nb-dm.png | r1 | manage | 19.9 K | 2010-09-07 - 15:15 | ThomasBird | B2DK D mass plot with 600/nb of real data |
Topic revision: r2 - 2010-11-05 - StefaniaRicciardi

Ideas, requests, problems regarding TWiki? Send feedback