
Difference: B2DPi (5 vs. 6)
Revision 62010-09-07 - ThomasBird
B- to D0 (K pi) Pi-Current statusntuple600/nb of data has been processed and stored in an ntuple. The CKM plot was produced with a 300/nb ntuple. These are stored at /opt/ppd/lhcb/tbird/ntuples/B2Dpi/str09-merged-data/B2Dpi_str09.root and /opt/ppd/lhcb/tbird/CKM-approved/ntuple/B2Dpi_str09.root (just realised the CKM ntuple got corrupted in copy, and the old one was deleted, so am re-downloading from grid. ~/gangadir/workspace/uoh35620/LocalXML/{146,150}/*/output/B2Dpi_str09.root are the individual files which made up this ntuple. If I don't get a chance to re hadd them together you should have 299/nb in total, see HowToMergeRootFiles) In the folder where the ntuples are, there are also the files needed to re-create them running ganga on each of the ganga python files in the directory should submit all the jobs needed to create them. You will need to merge all these data files to get one like the above, to do this, see HowToMergeRootFiles.CutsSelection have been developed for this channel, they are listed below along with monte carlo simulated efficiencies of these cuts.#define Name_Of_Cuts "thomas mod - low mv and dipchi2 with bac pid" #define Negative_D_Daughter_PT_Cut 300 #define Positive_D_Daughter_PT_Cut 300 #define Negative_D_Daughter_MINIPCHI2_Cut 9 #define Positive_D_Daughter_MINIPCHI2_Cut 9 #define Negative_D_Daughter_P_Cut 2000 #define Positive_D_Daughter_P_Cut 2000 #define Negative_D_Daughter_TRACK_CHI2NDOF_Cut 8 #define Positive_D_Daughter_TRACK_CHI2NDOF_Cut 8 #define Bachelor_PT_Cut 300 #define Bachelor_MINIPCHI2_Cut 9 #define Bachelor_P_Cut 2000 #define Bachelor_TRACK_CHI2NDOF_Cut 8 #define Bachelor_PIDK_Cut 10 #define D_FDCHI2_OWNPV_Cut 100 #define Z_Dist_Cut -1 #define D_ENDVERTEX_CHI2_D_ENDVERTEX_NDOF_Cut 15 #define D_IPCHI2_OWNPV_Cut 9 #define D_PT_Cut 2000 #define B_FDCHI2_OWNPV_Cut 64 #define B_ENDVERTEX_CHI2_B_ENDVERTEX_NDOF_Cut 10 #define B_IPCHI2_OWNPV_Cut 16 #define B_DIRA_OWNPV_Cut 0.9999 #define Negative_D_Daughter_PIDK_211_Cut 10 #define Positive_D_Daughter_PIDK_211_Cut 10 #define Positive_D_Daughter_PIDK_321_Cut 10 #define Negative_D_Daughter_PIDK_321_Cut 10 #define D_M_Window_Cut 21 #define B_M_Window_Cut 50This is also in a file at /opt/ppd/lhcb/tbird/analysis/cuts/thomas.with.bac.pid.cuts.h Cut info:
nPV 1 2 3 4 5 1-5
-1 Strip Eff : 19.64% 13.50% 9.14% 6.50% 5.03% 14.62%
2 D daughter : 86.47% 84.38% 82.13% 78.61% 72.87% 13.60%
3 bachelor : 94.74% 94.00% 93.45% 92.05% 89.48% 5.26%
4 after D cut: 74.69% 74.48% 73.01% 73.82% 72.01% 2.67%
5 after B cut: 93.06% 92.83% 92.88% 90.67% 92.75% 0.31%
6 after PID : 85.13% 83.30% 82.11% 81.01% 76.54% 8.59%
7 nPV : 100.00% 100.00% 100.00% 100.00% 100.00% 0.00%
8 event nr : 100.00% 100.00% 100.00% 100.00% 100.00% 0.00%
9 D mass : 97.52% 97.33% 97.57% 97.37% 96.35% 1.17%
9 B mass : 97.74% 97.63% 97.18% 96.99% 97.73% 0.01%
Overall Eff: 46.20% 43.40% 40.52% 37.05% 31.39% 14.81%
Error: 0.18% 0.22% 0.37% 0.75% 1.62%
Cut info:
0 tot lumi : 0.00e+00 nb-1 +/- 0.00e+00 nb-1
0 tot cands : 899409
1 evt bfr cut: 148832
2 D daughter : 126390 84.92% +/- 0.09%
3 bachelor : 119105 94.24% +/- 0.07%
4 after D cut: 88601 74.39% +/- 0.13%
5 after B cut: 82306 92.90% +/- 0.09%
6 after PID : 69156 84.02% +/- 0.13%
7 nPV : 69156 100.00% +/- 0.00%
8 event num : 69156 100.00% +/- 0.00%
9 D mass : 67396 97.46% +/- 0.06%
9 B mass : 65794 97.62% +/- 0.06%
Overall Eff: 44.21% +/- 0.13%
Using the value of fsig (ratio of signal to background) from the fit of the MC data the efficiency of the cuts was determined to be (44.0+/-0.1)%. This can be found in the output from the analysis root macro.
When doing this it is important you don't use the number of entries in the histogram as this includes the over and underflow bins, instead use the value of bm->Integral() where bm is the object holding the B mass histogram. Also be careful you don't use the number from the D mass histogram as this will not be exactly the same as the entries in the B mass histogram.
The event number says its 100% efficient, its not, the efficiencies are done on an event by event basis, but at this point the number of candidates per event is made to be 1, so although the event number does not change, it does reduce the number of overall candidates, but not by too much, maybe 1%.
Plots | |||||||||
| Added: | |||||||||
| > > | all these plots are created from graphs in root files stored in /opt/ppd/lhcb/tbird/analysis/b2dpi/ | ||||||||
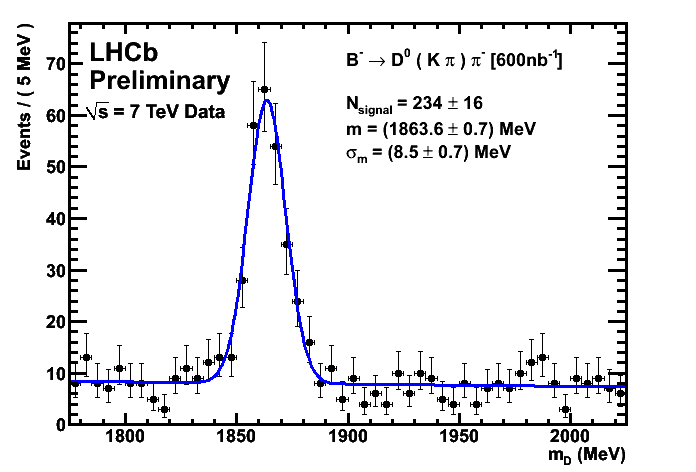
600/nb Plots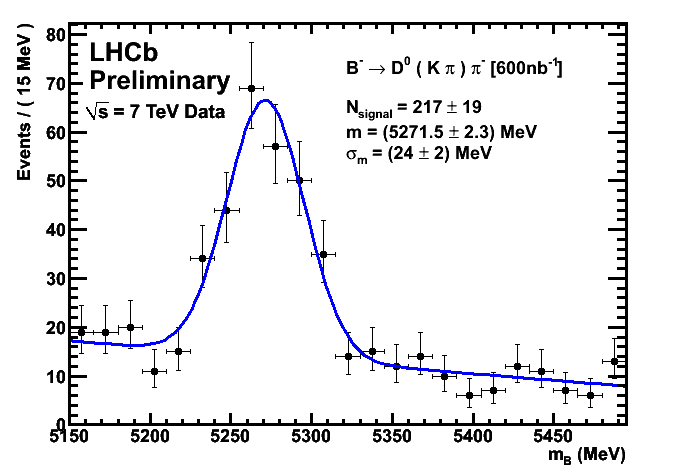
CKM Plots 300/nb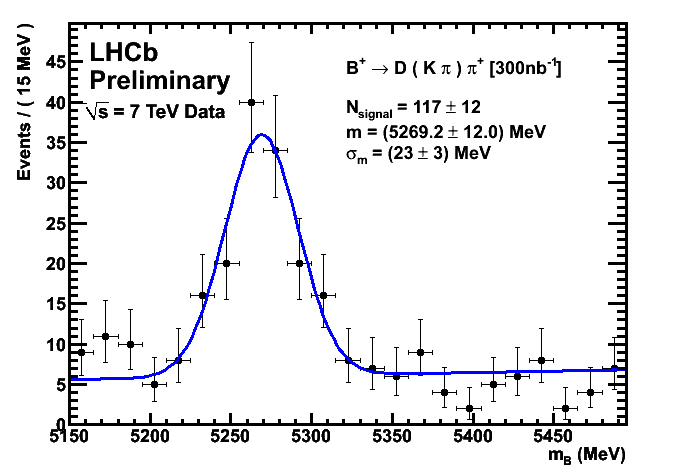
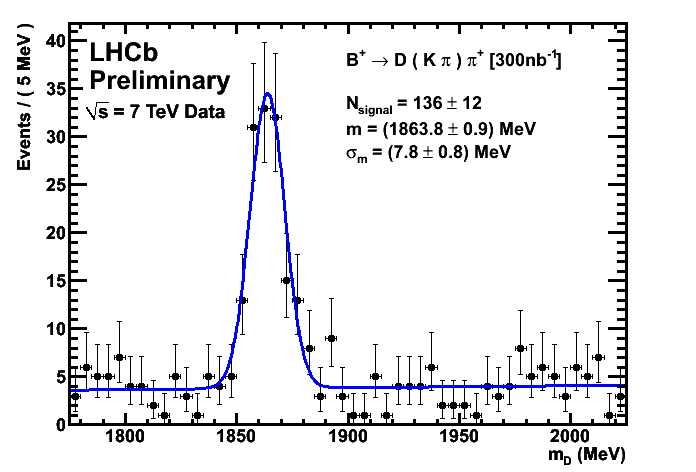
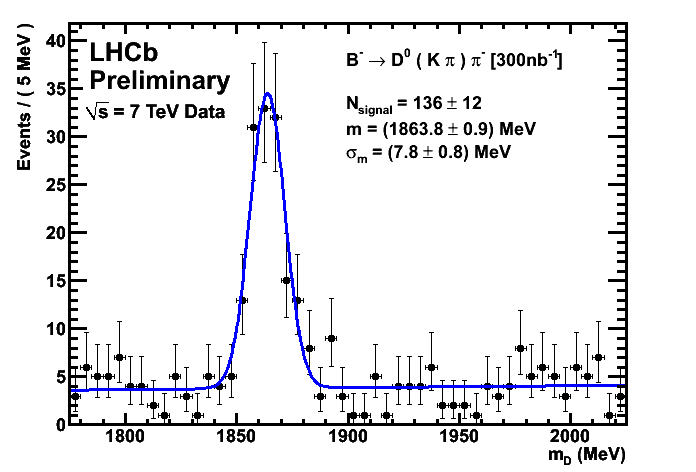
Improved CKM Plots 300/nb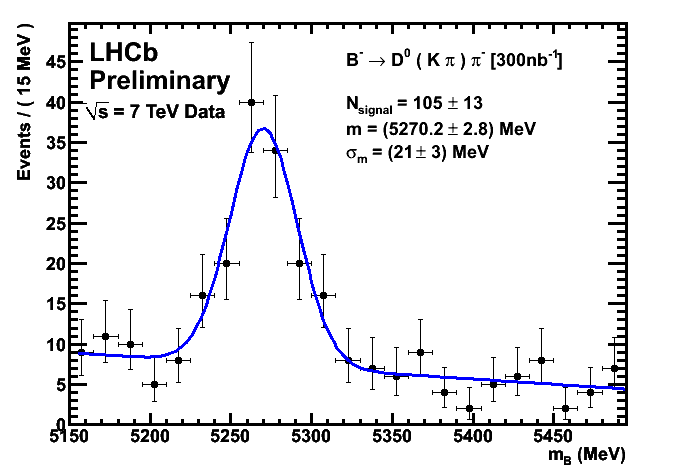
 | |||||||||
| Added: | |||||||||
| > > | Analysis scripts
| ||||||||
Getting DataGetting the ntuplesThe B2Dpi ntuples are in /opt/ppd/lhcb/tbird/ntuples/B2Dpi from there you can choose pre st petersberg data (very small), down or up, or lots of stripping-09-merged data (supposed to be 1000/nb) not seperated into down and up.Analysing the ntupleHaving run the BachellorAnalsys macro on the above ntuples you should have files like those saved in /opt/ppd/lhcb/tbird/analysis/b2dpi. the 300nb folder should be very simalar to the CKM one as it should be on the same data. the 600nb one should be exactlyPresenting Graphs | |||||||||
| Changed: | |||||||||
| < < | -- ThomasBird - 2010-09-03 | ||||||||
| > > | There are macros in the /opt/ppd/lhcb/analysis sub directories called lhcb-graph-*.C which are the macros to make format them as per the LHCb guidelines. these also re-bin and re-run the fits if necessary. | ||||||||
| Added: | |||||||||
| > > | -- ThomasBird - 2010-09-07 | ||||||||
| |||||||||
| Changed: | |||||||||
| < < |
| ||||||||
| > > |
| ||||||||
| Added: | |||||||||
| > > |
| ||||||||
View topic | History: r7 < r6 < r5 < r4 | More topic actions...
Ideas, requests, problems regarding TWiki? Send feedback